
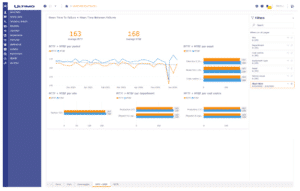

In order to make the right choices, insight is essential. To help you with this, we have made the following KPI’s available within Ultimo’s Power BI Dashboards:
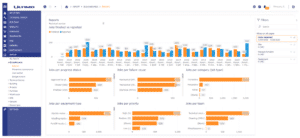
- Report Dashboard. Create insight into your daily operation for yourself and other departments. Which work tasks are outstanding and who is responsible for taking care of them? This helps to improve communication and mutual understanding between departments.
- Planned Maintenance Percentage. Unplanned downtime is one of the biggest cost drivers within an organization. Planned maintenance prevents unplanned failure.
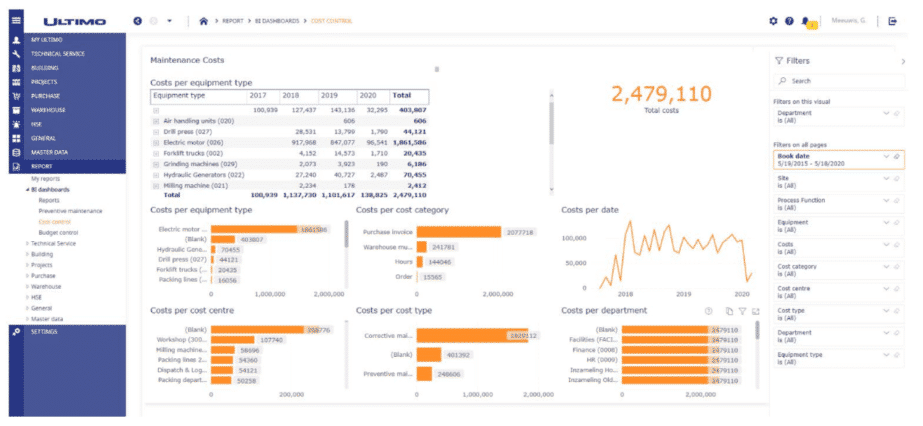
- Maintenance costs. Who is the bad actor between your assets? Where do your maintenance costs go to or what departments cause the most costs? All important questions on which you want to act.
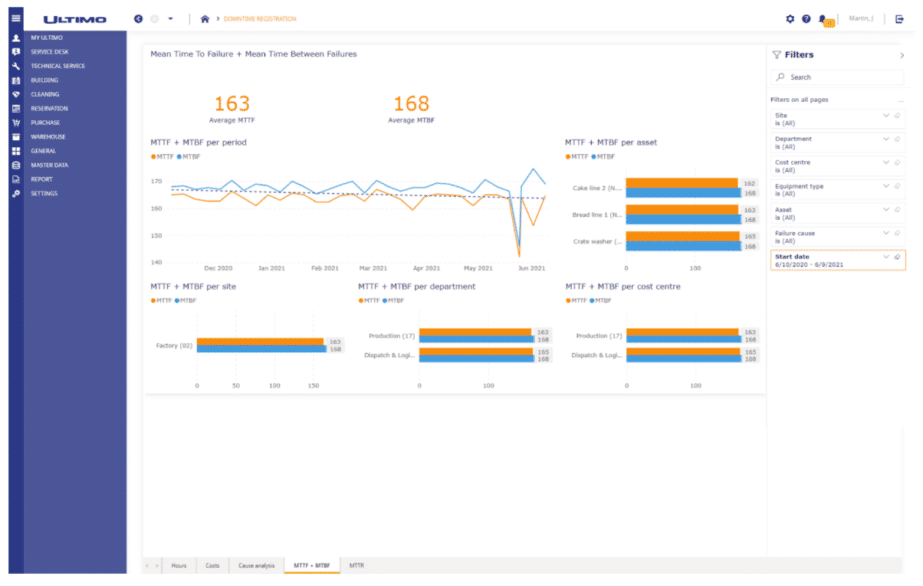
- Downtime Registration. Are you getting the most out of your assets and where can you improve?
All standard dashboards are available within your Ultimo EAM SaaS platform. They provide a perfect basis to start with integrated overviews that connect multiple data sources.
About Power BI
What is Power BI? Connect to and visualize any data using the unified, scalable platform for self-service and enterprise business intelligence (BI) that’s easy to use and helps you gain deeper data insight.
Share this solution
Contact an expert